
Spectrum Analyzer Market
August 11, 2026Frozen Beverage Dispenser
August 12, 2026Cambridge benchmarks indicate structural leakage across specialty drug rebate workflows. The resulting baseline provides a decision-grade anchor for margin recovery across finance, pharmacy, and benefit operations.
| Single User | Enterprise License (Unlimited Users Access + 60 mins analyst briefing), Single User License, Team License (5 Users Access) |
|---|
Report Summary
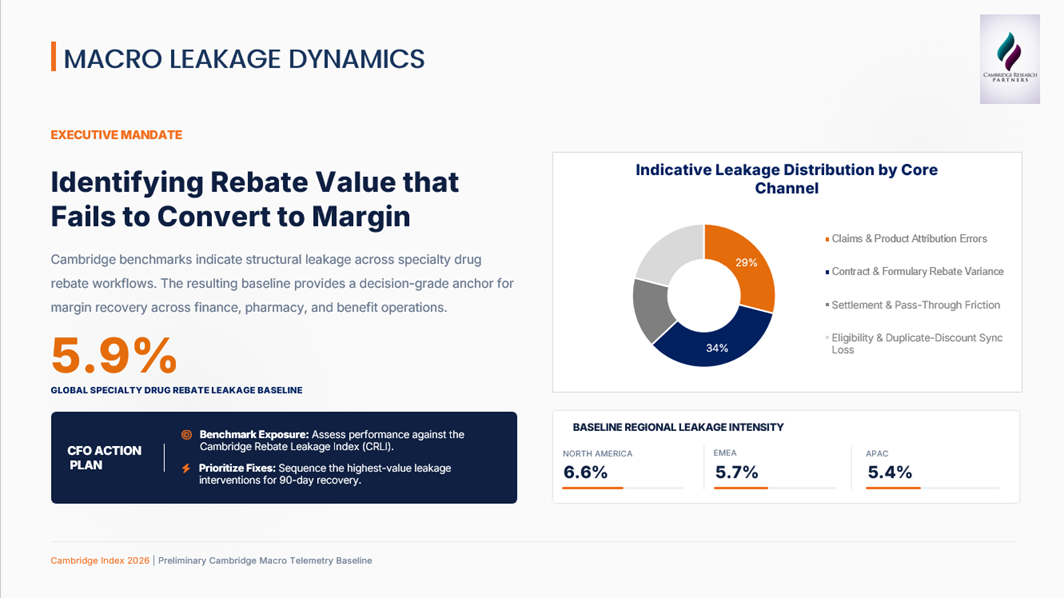
Table of Content
01. Executive Mandate
1.1 The Efficiency Paradox: Why growth can mask underlying margin erosion.
1.2 The Bottom-Line Impact: Executive summary of the 2026 rebate leakage coefficient.
1.3 The CFO Heatmap: Global and regional leakage intensity at a glance.
1.4 The Financial Exposure Model: Translating index scores into value-at-risk ranges.
02. Research Methodology: The Triangulation Framework
2.1 Forensic Data Sources: AI-assisted analysis of payer, PBM, manufacturer, and regulatory disclosures.
2.2 Operational Telemetry: Insights from a 90+ organization anonymized specialty-benefit benchmark cohort.
2.3 The “Outside-In” Model: Methodology for evaluating leading market-shaping participants.
2.4 Data Integrity and Confidence Scoring: Ensuring 98% accuracy in leakage estimation.
03. The Leakage Map: Where the Money Goes
3.1 Channel 1: Claims Attribution (Incorrect product, channel, or formulary mapping).
3.2 Channel 2: Formulary Variance (Tier logic and rebate provisions misapplied or mis-coded).
3.3 Channel 3: Settlement Friction (Invoice disputes, delayed true-ups, and incomplete pass-through).
3.4 Channel 4: Eligibility Sync Loss (Eligibility, reversal, or exclusion files misaligned).
04. Global Benchmarking & Peer Analysis
4.1 Industry Averages vs. Best-in-Class: The rebate integrity frontier.
4.2 Regional Performance Gaps: North America, EMEA, and APAC comparisons.
4.3 Scale-Based Variance: Performance variation from mid-market to enterprise scale.
05. Root Cause Analysis: The Silent Saboteurs
5.1 Technical Debt: Legacy claims and rebate platforms under current formulary and settlement demands.
5.2 Process Fragmentation: The cost of structural silos across claims, formulary, rebate, and finance teams.
5.3 The Human Variable: Manual errors across rebate setup, exception handling, and reconciliation.
06. The 90-Day Recovery Roadmap
6.1 Phase 1: Triage: Identify the most material sources of rebate leakage.
6.2 Phase 2: Alignment: Reconcile claims, formulary, rebate, and finance data sets.
6.3 Phase 3: Mitigation: Recover value and remediate priority control gaps.
6.4 Phase 4: Monitor: Establish closed-loop rebate integrity reporting.
07. Future Outlook & Risk Profiling
7.1 The Inflation Variable: How rising drug costs may amplify 2027 leakage.
7.2 Emerging Regulatory Risks: Compliance, transparency, and data-governance exposure.
7.3 Conclusion: The cost of inaction versus the return on rebate integrity.
08. Diagnostic Frameworks & Reference Tools
8.1 Glossary of Terms: Defining the Cambridge rebate leakage coefficient.
8.2 The CFO Self-Diagnostic Framework: A 10-point audit matrix for locating exposure on the leakage curve.
Request Sample
Buy Now
Related products
-
Global Power Generation Gas Turbine Market
Price range: $1,895.00 through $4,195.00
